“NDepend is a Visual Studio tool to manage complex .NET code and achieve high Code Quality. With NDepend, software quality can be measured using Code Metrics, visualized using Graphs and Treemaps, and enforced using standard and custom Rules.” – When I visited their site for the first time, I thought it must be just another tool in the market. But, today after using it for a test run, I must say ‘This is THE TOOL in the market’ to what they called ‘Make your .NET Code Beautiful’.
Today I am going to write about one of the many features available in this beautiful tool – Analyzing .Net Assemblies. Today morning one of my team has delivered a small module to me for review purpose and I started reviewing it with NDepend. So, here we go:
Open NDepend and select the highlighted option as shown below:
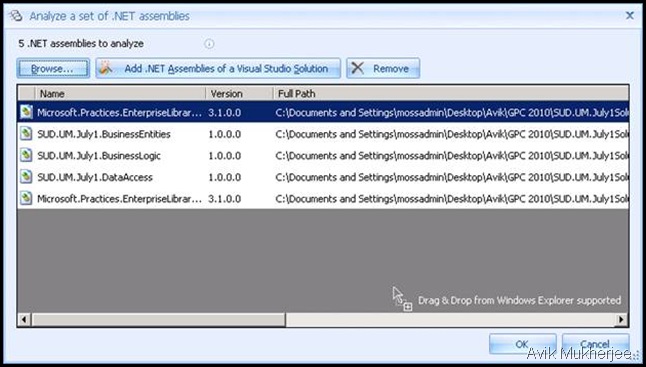
Next, you browse/drag-drop assemblies that you want to analyze and select OK:
Now, NDepend analyzes the assemblies and shows the result in one web browser window and if you want, the result can be shown in the tool itself. I went for the second option and here is the result –
So far, so good… 13 warnings mostly related to other assemblies couldn’t be found type. So, lets explore how beautiful code my boys have written.
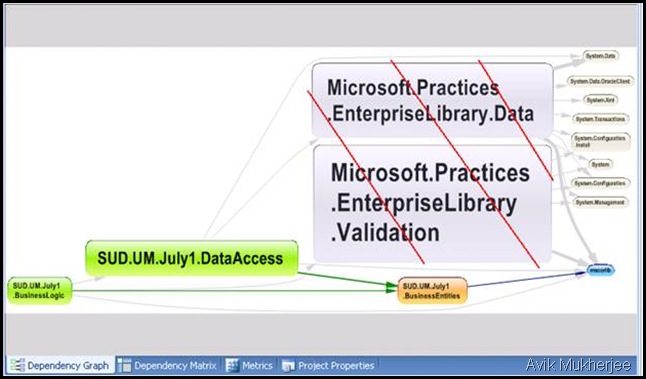
Dependency Graph:
As I am not bothered with Microsoft’s patterns and practices related functionalities, we will look into our Business Entity, Business Logic and Data Access Classes.
So, the dependency among the assemblies are perfect. Next we are going to focus on the interaction that is going to happen between Business Logic((BL) and Data Access Layer(DAL). So, I have selected Dependency Matrix and placed my mouse at cross section of BL and DAL and the result is ‘7 methods of the BL assembly is using 8 methods of the data access class’(Look at Dependency Info panel at the right hand) :
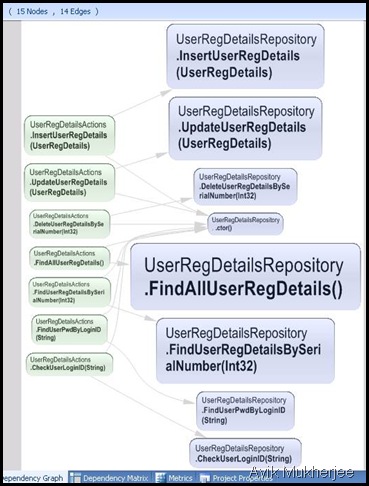
Left click on it to find out detailed results:
Wooowww… Great work by NDepend and my team also!!!
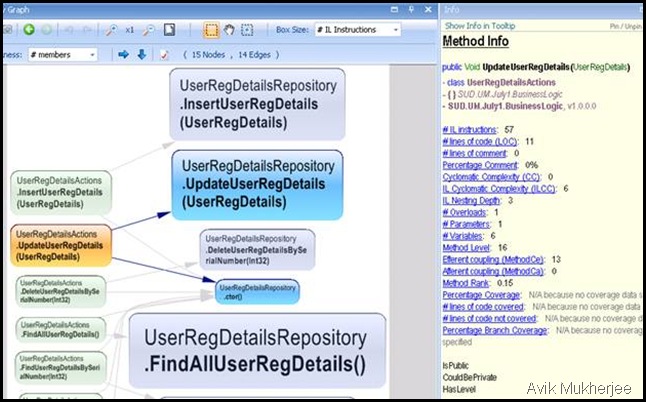
So, these are the methods written by my team. Let’s explore one of them – the 2nd one ‘UpdateUserRegDetails(UserRegDetails)’. Just select the that method and the summary can be found at the right hand side ‘Method Info’ section:
IL Instruction is 57 i.e., less than 100 and so good for the health of the method.
I am a little bit confused on ‘Percentage Comment’ output as after seeing a big zero (0 comment!!!), I immediately opened up the solution and found comments are present across all the methods as per my checklist!
Cyclometric Complexity higher than 20 is bad and in our case though the result is 0, my calculation says it should be 1, but may be our base formula are different.
ILCC below 20 is acceptable and in our case it is 6.
So, in this way I was able to review the code base pretty quickly and it helped me to take a loooong coffee break :)
One can use a metric view also to have a look at the solution as shown below:
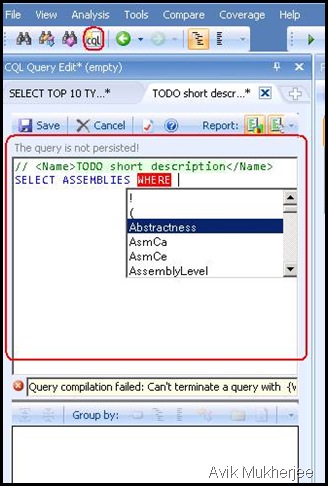
Another fundoo feature of the tool is CQL query editor with intellisense – I am loving it…
So all together we can say only 2 words : NDepend Rocks :)




No comments:
Post a Comment